
Advanced Integration with External Tools
JArchitect provides many interesting features to explore and treat the data extracted from the analysis phase. It's very interesting to use
these features to treat the analysis data from the other popular static analysis tools.
JArchitect embed now out of the box the following analysis tools: PMD,CheckStyle and FindBugs.
Using the CQlinq request language help to explore better the static analysis tools. indeed one of the problems with code quality tools is that they tend to overwhelm developers with problems that aren’t really problems — that is, false positives. When false positives occur, developers learn to ignore the output of the tool or abandon it altogether. To explore better their result, it’s interesting to have a way to focus only on what we want and gives to developers a useful view.
Integration with SonarQube
JArchitect provides now the SonarQube plugin. Here are the features provided:- Both JArchitect default and custom code rules can be monitored by SonarQube.
- Visualization of the JArchitect issues locations in source code from within the SonarQube UI.
- Two widgets are provided:
- Class Metrics:JArchitect calculate many interesting class metrics related to their design and implementation, some of these metrics could be discovered by this widget.
- CQLinq queries widget:CQLinq is a powerful feature to create easily coding rules. To explore the results of the CQLinq queries.
Colored Code Metric View
The Metric View can now display a second metric by coloring the treemap elements. Hence two code metrics can be displayed at once.
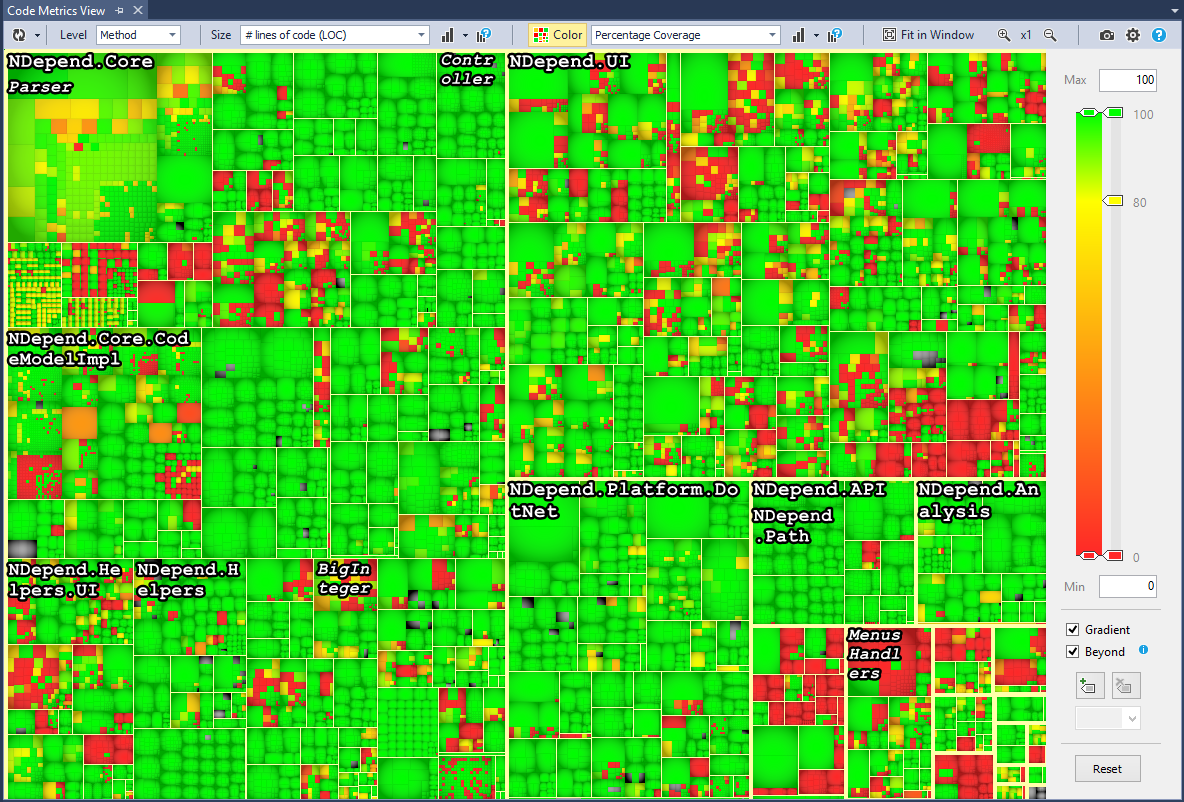
For example by setting Size metric to number of lines of code vs. Color metric to percentage code coverage, we can get a global, yet accurate, view of where the code base is not enough covered by tests.
The screenshots below shows the JArchitect v5 code base, 160K Lines of Code 82% covered by tests. We know at a glance where we've been good and where more tests effort should be spent.
By choosing adequate pairs of metrics, many other insightful views can be obtained, relative to code quality, code flaws, code structure, code diff...
Coloring can be customized and custom code metrics, defined through CQLinq querying, can be displayed as well as size or color metric.
Android Support
With JArchitect5 you can now analyze the .apk files. You can now understand and improve your android projects using all JArchitect features.Rule Files Shareable amongst Projects
With JArchitect v5, Rule Files can be created and shared amongst JArchitect projects. This is useful to define company-level standard rules sets, and get them applied by all teams.

JaCoCo Support
Writing automatic tests is a central practice to increase code correctness. Knowing which part of the code is covered by automatic tests helps improving tests and consequently, it helps increasing code correctness. JArchitect 5 gathers code coverage data from Cobertura and JaCoCo. From this data, JArchitect infers some metrics on methods, types, packages and projects : PercentageCoverage, NbLinesOfCodeCovered, NbLinesOfCodeNotCovered and BranchCoverage. These metrics can be used conjointly with others JArchitect features. For example you can know what code have been added or refactored since the last release and is not thoroughly covered by tests. You can write a CQLinq rule to continuously check that a set of classes is 100% covered. You can list which complex methods need more tests.With JArchitect, software quality can be measured using Code Metrics, visualized using Graphs and Treemaps, and enforced using standard and custom Rules.