
Latest Screenshots
Visual JArchitect
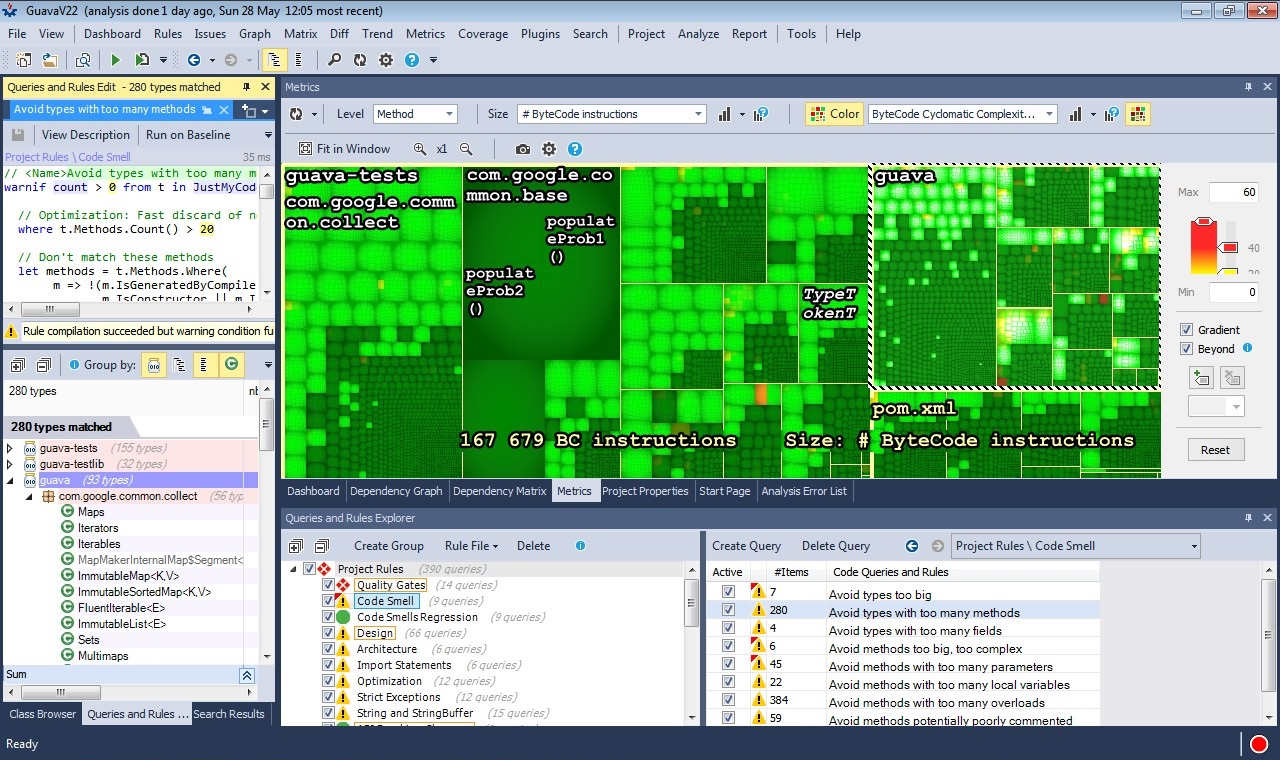
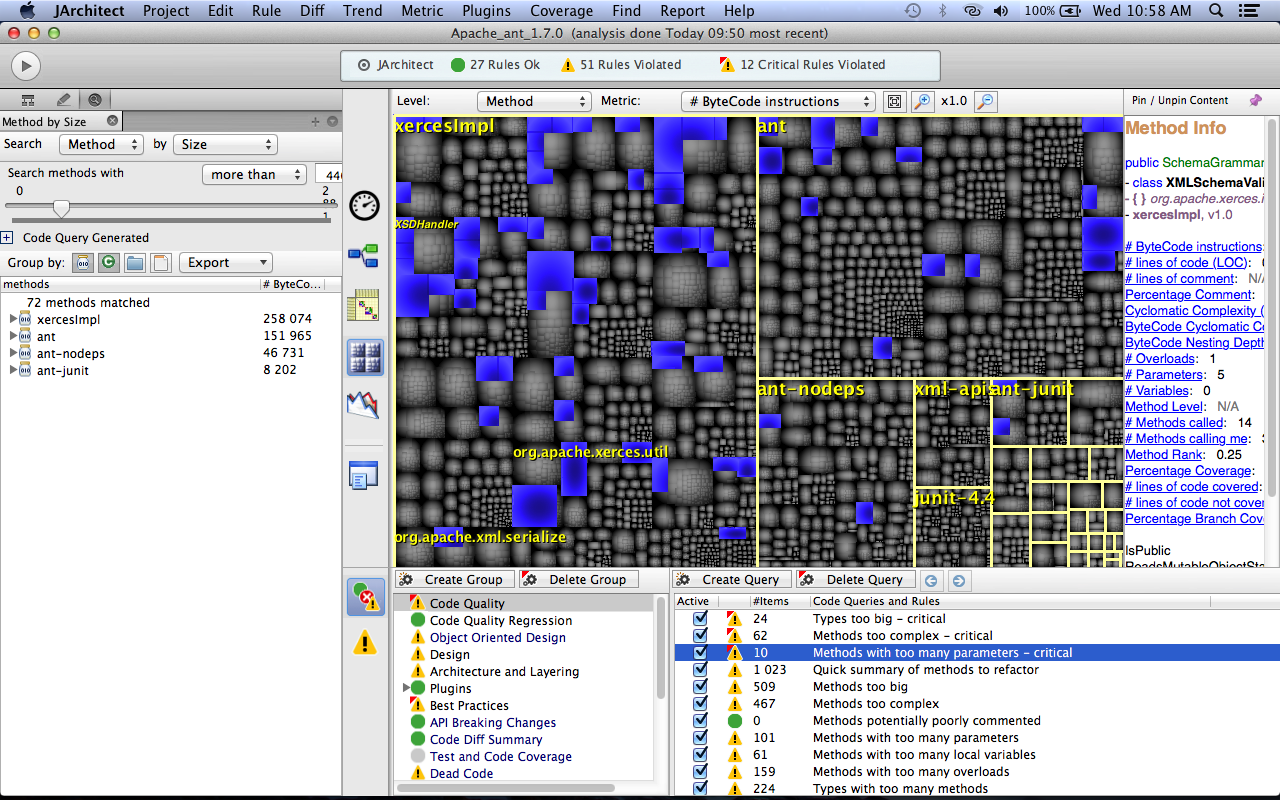
Selection by Metrics and display the set of types selected on the Metrics View.
Generating a graph from the Dependency Structure Matrix of a dependency cycle between some projects.
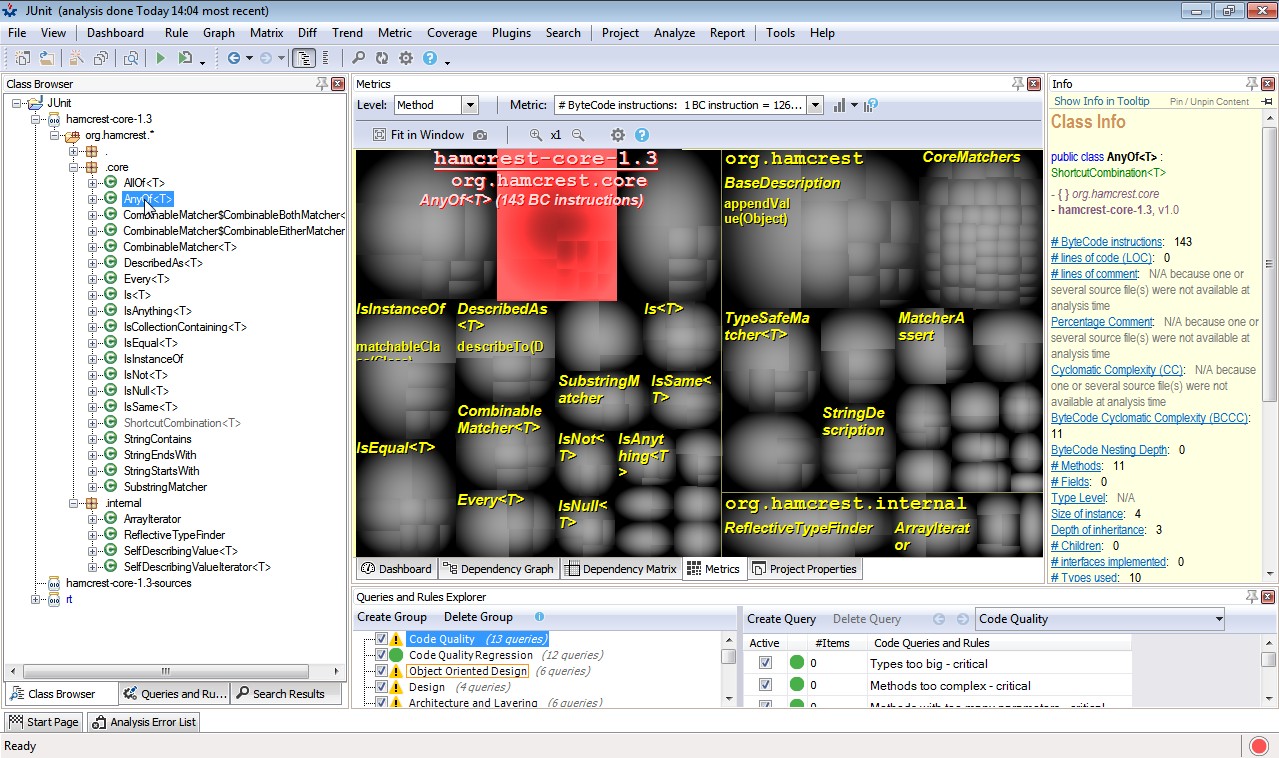
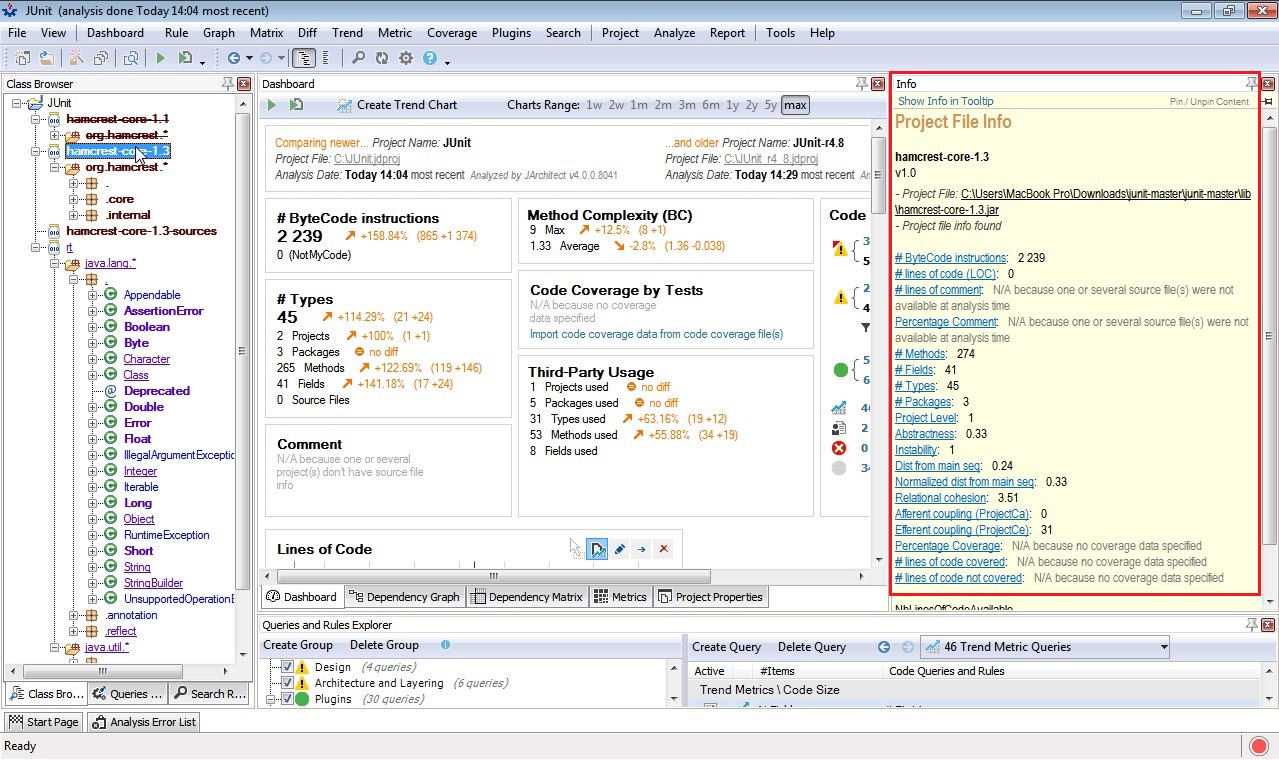
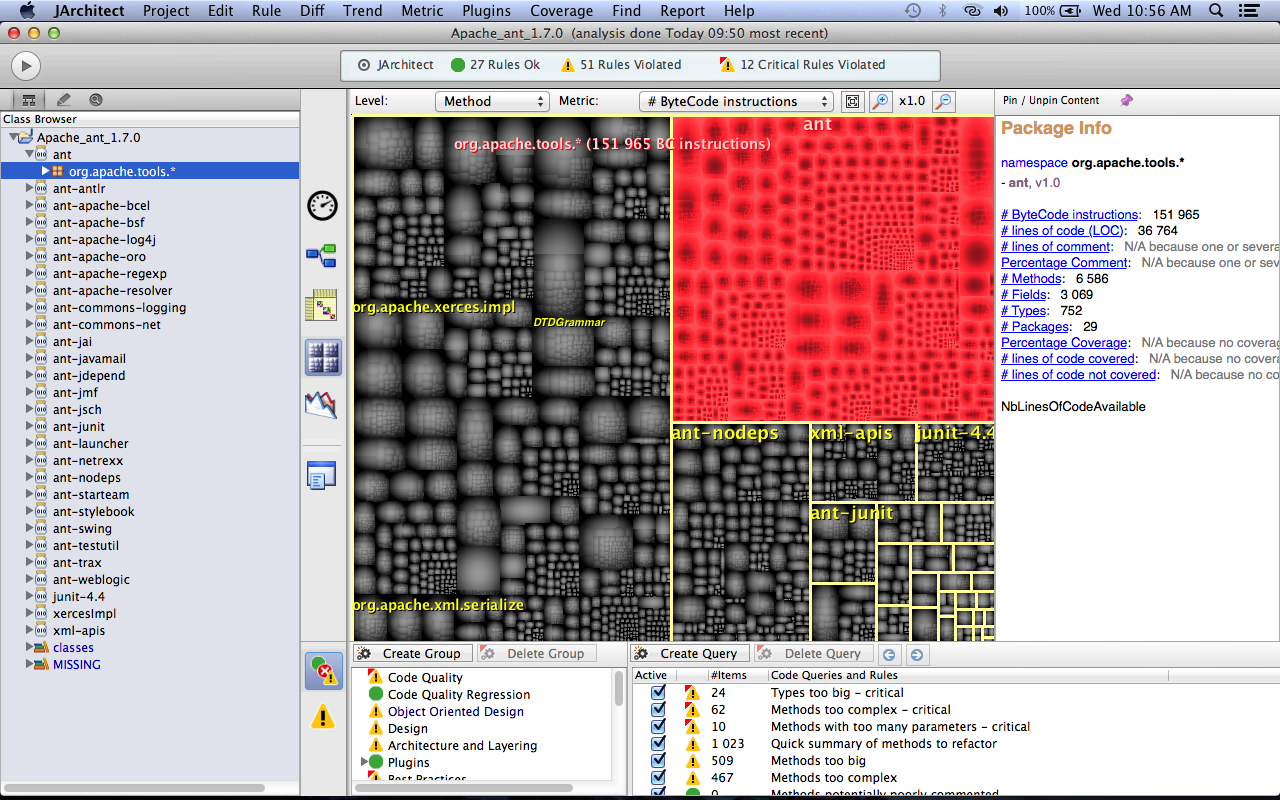
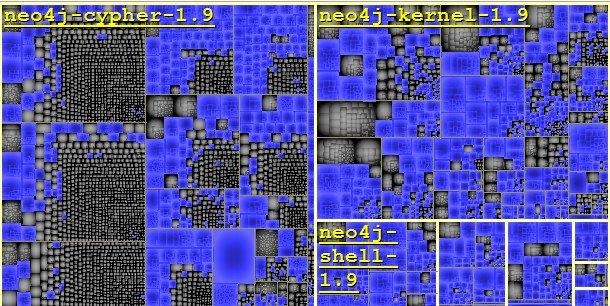
Using the Metrics view to browse the structure.
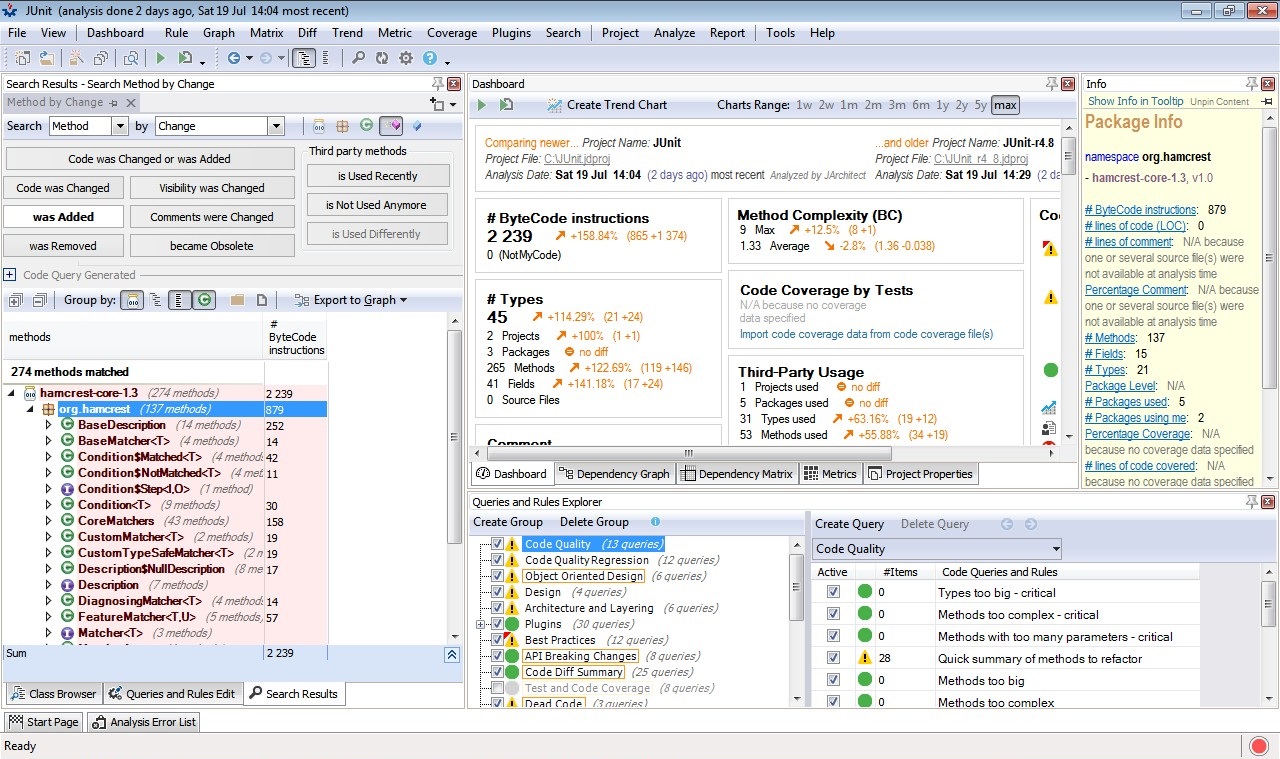
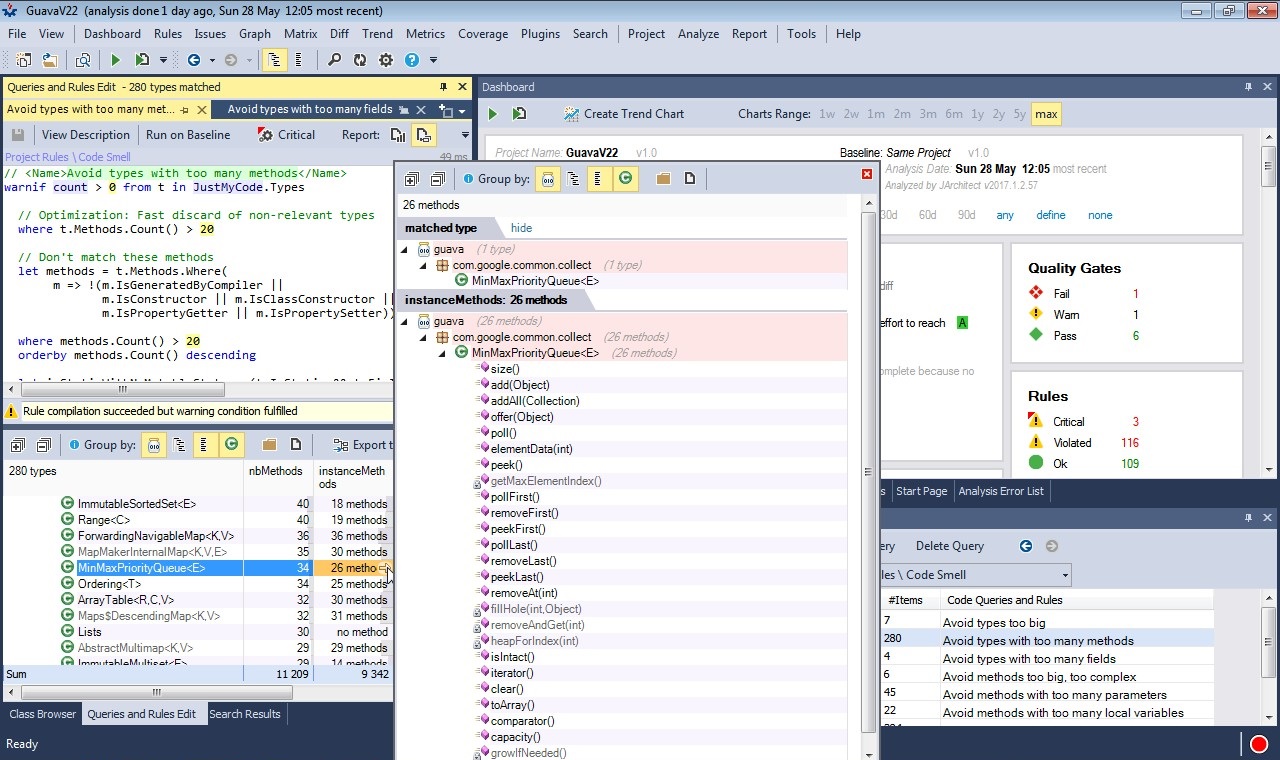
Selecting the list of methods where the code was added between 2 versions.
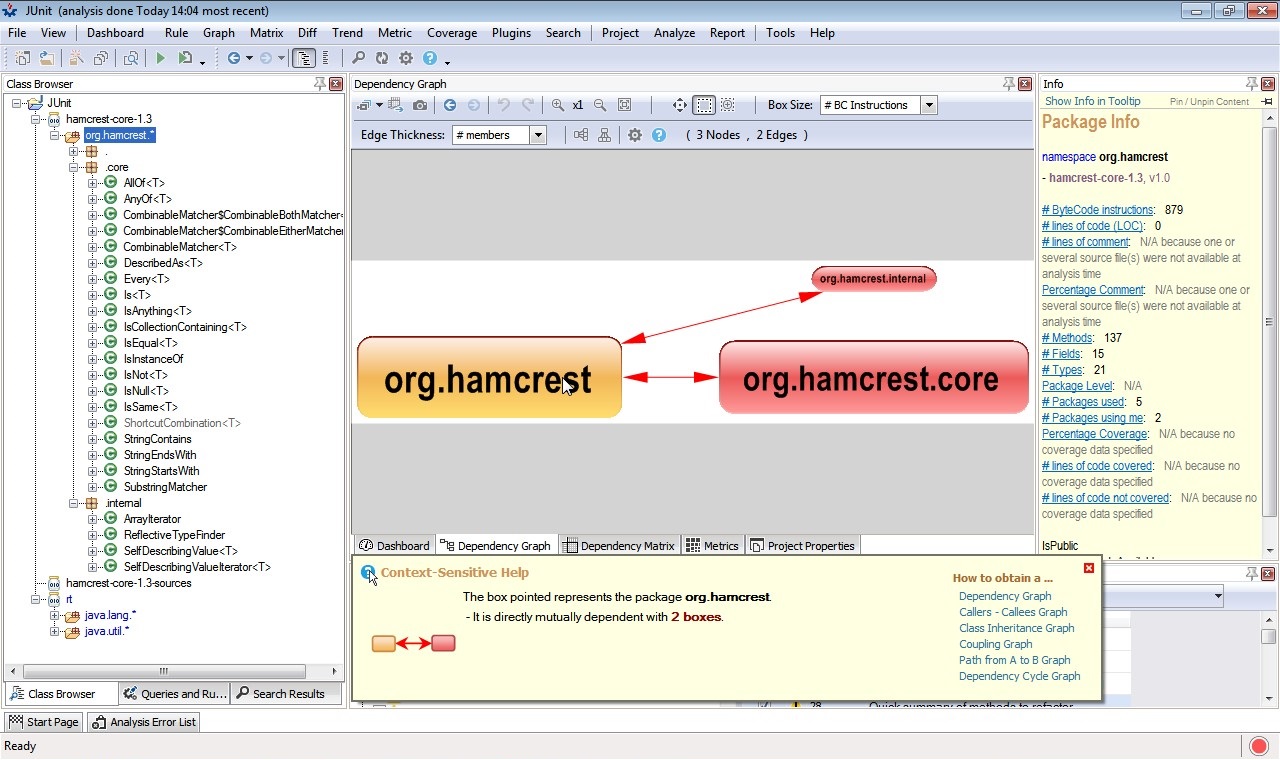
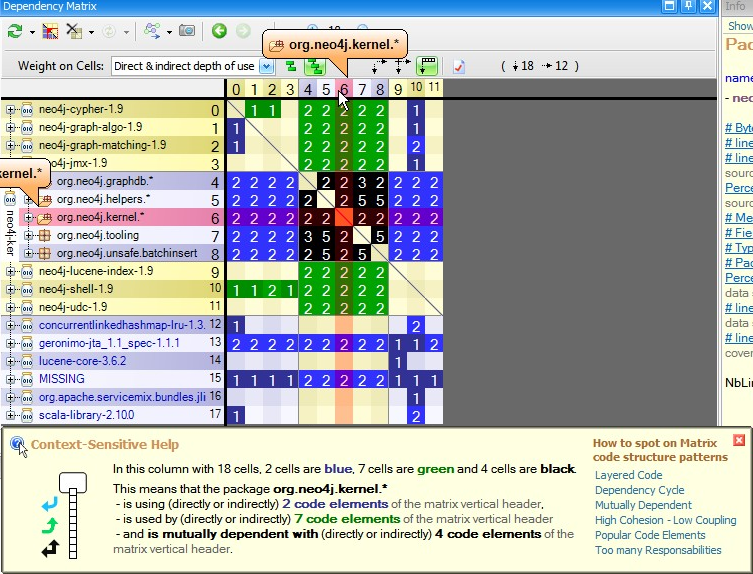
The Help panel.
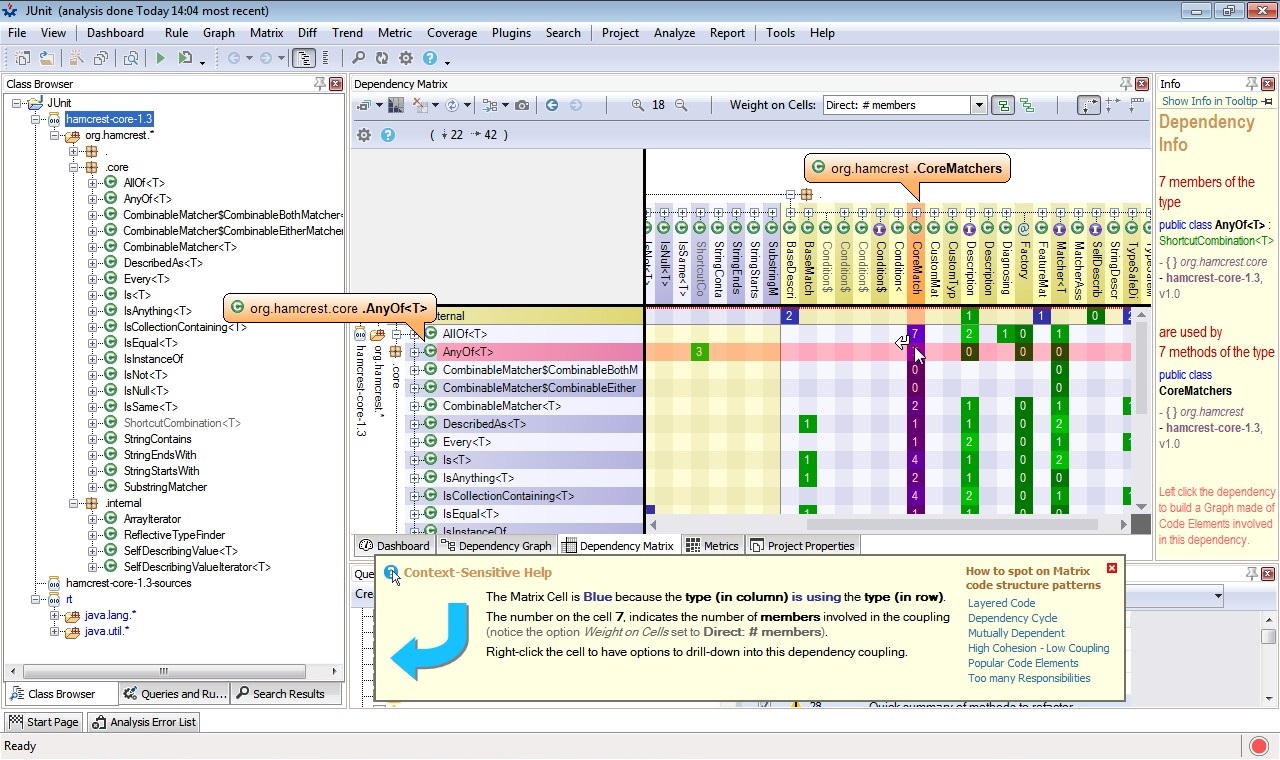
Using the Dependencies Structure Matrix to understand coupling between projects.
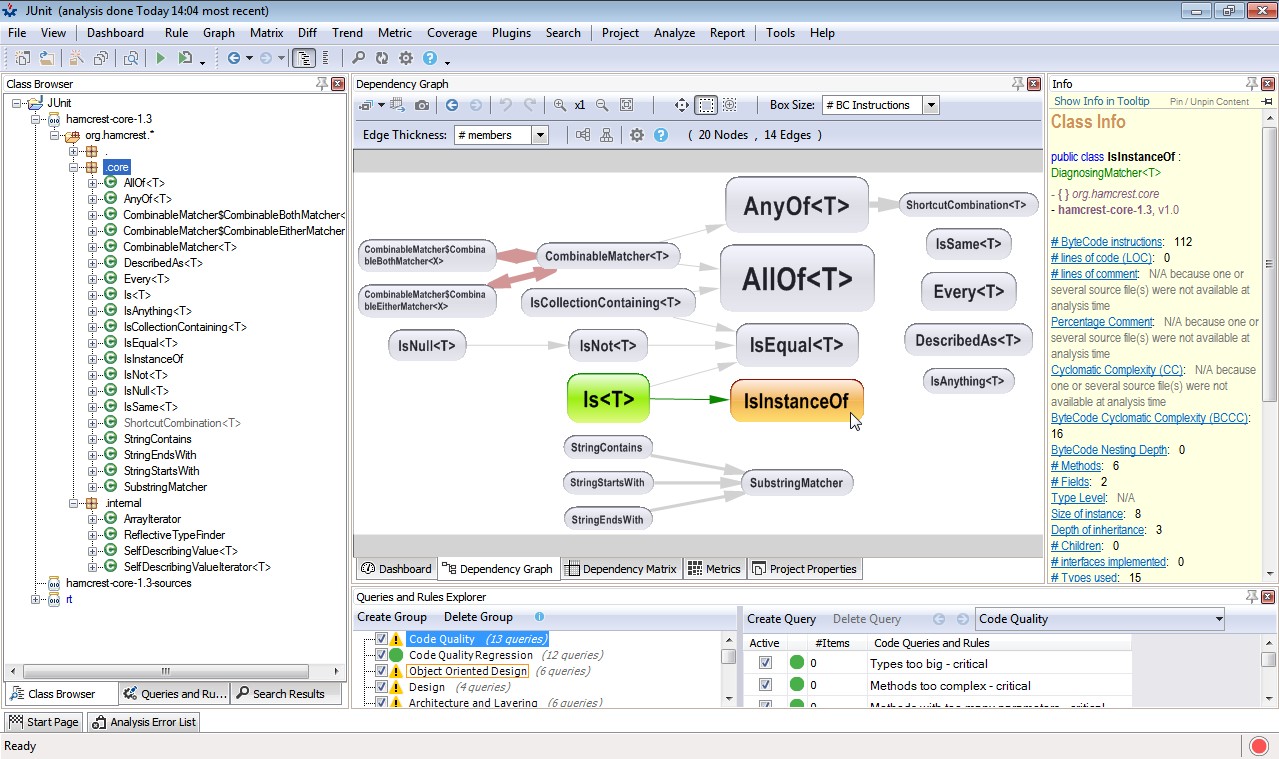
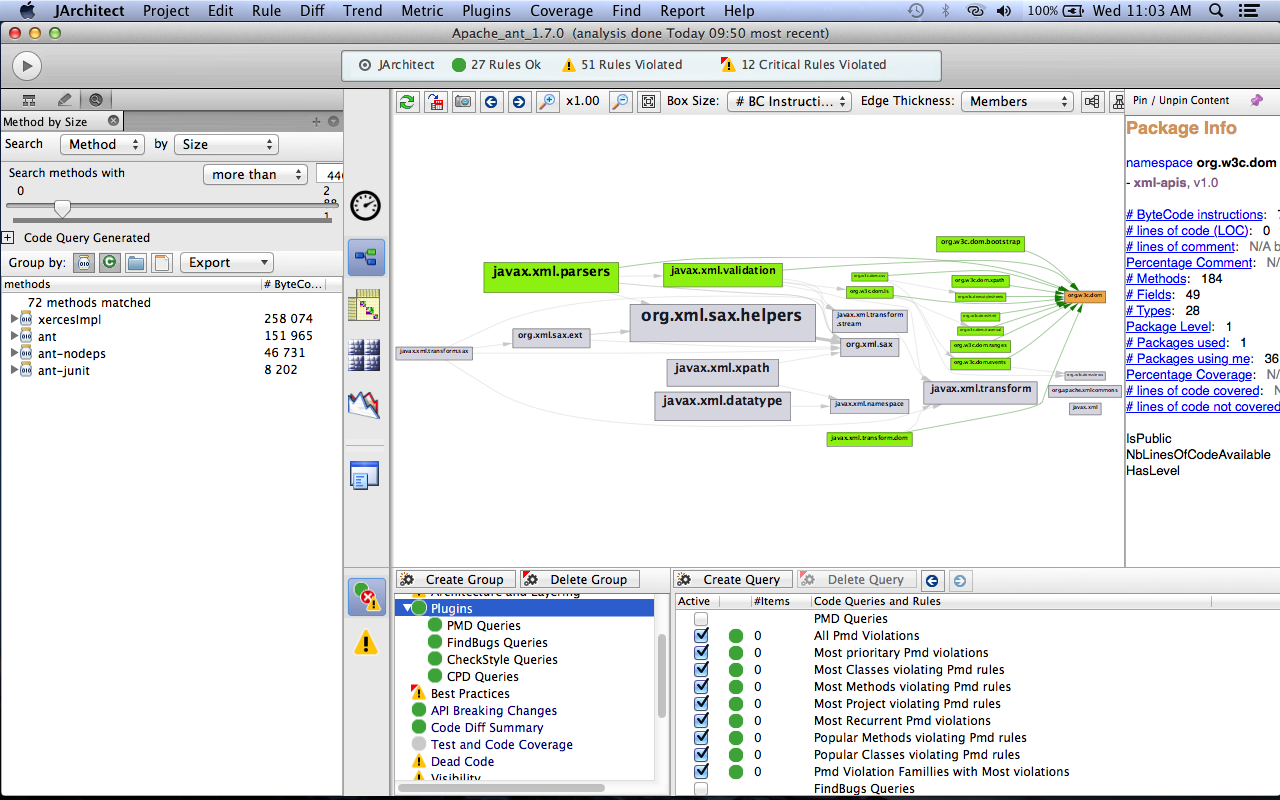
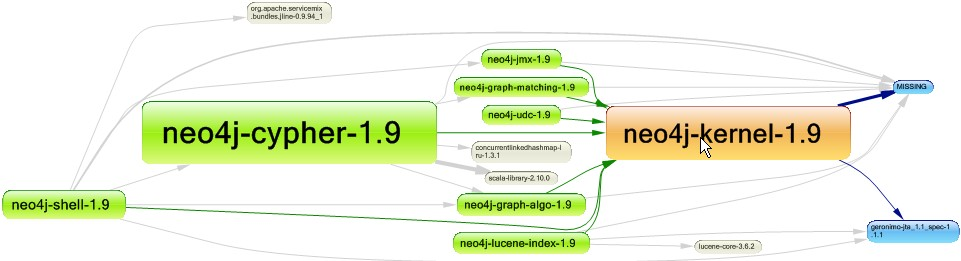
A generated graph of dependencies between some projects.
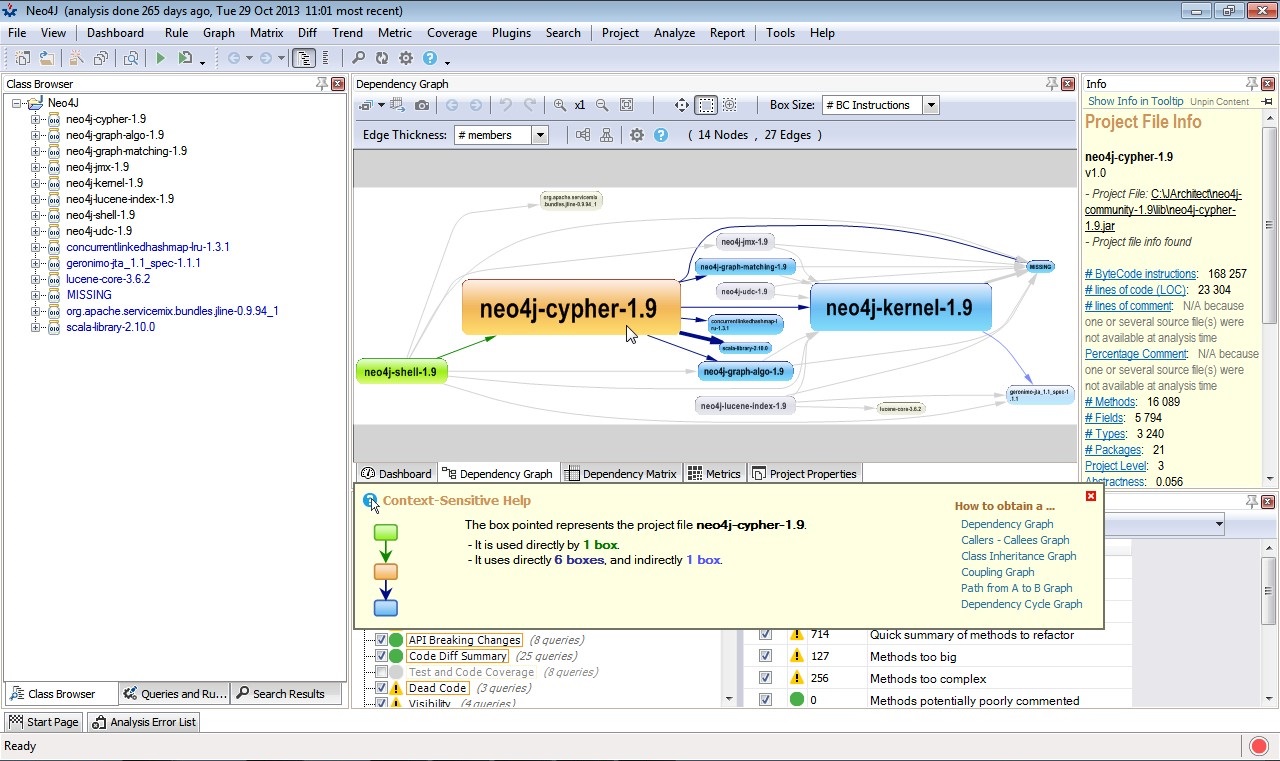
Using the Graph view to browse the structure.
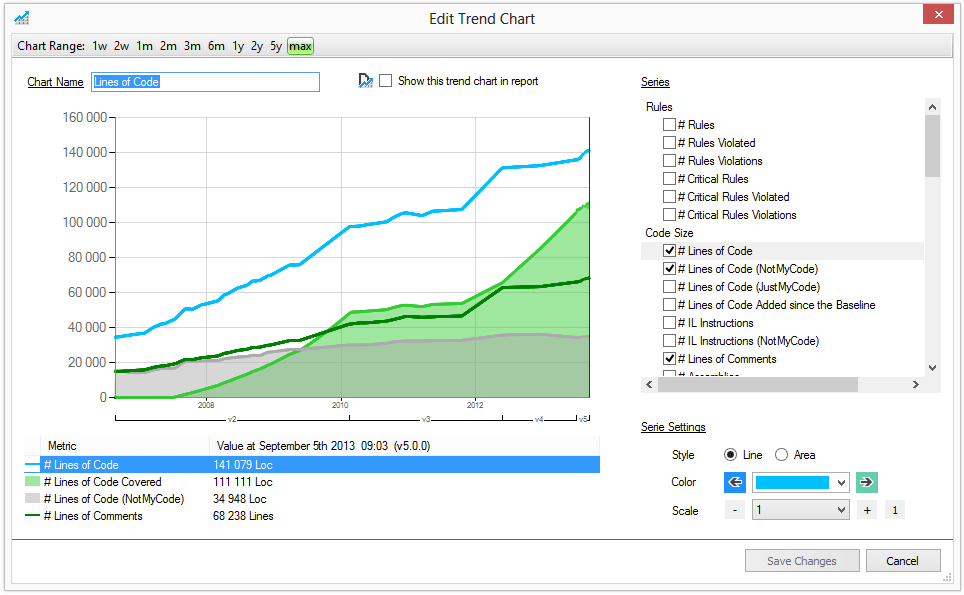
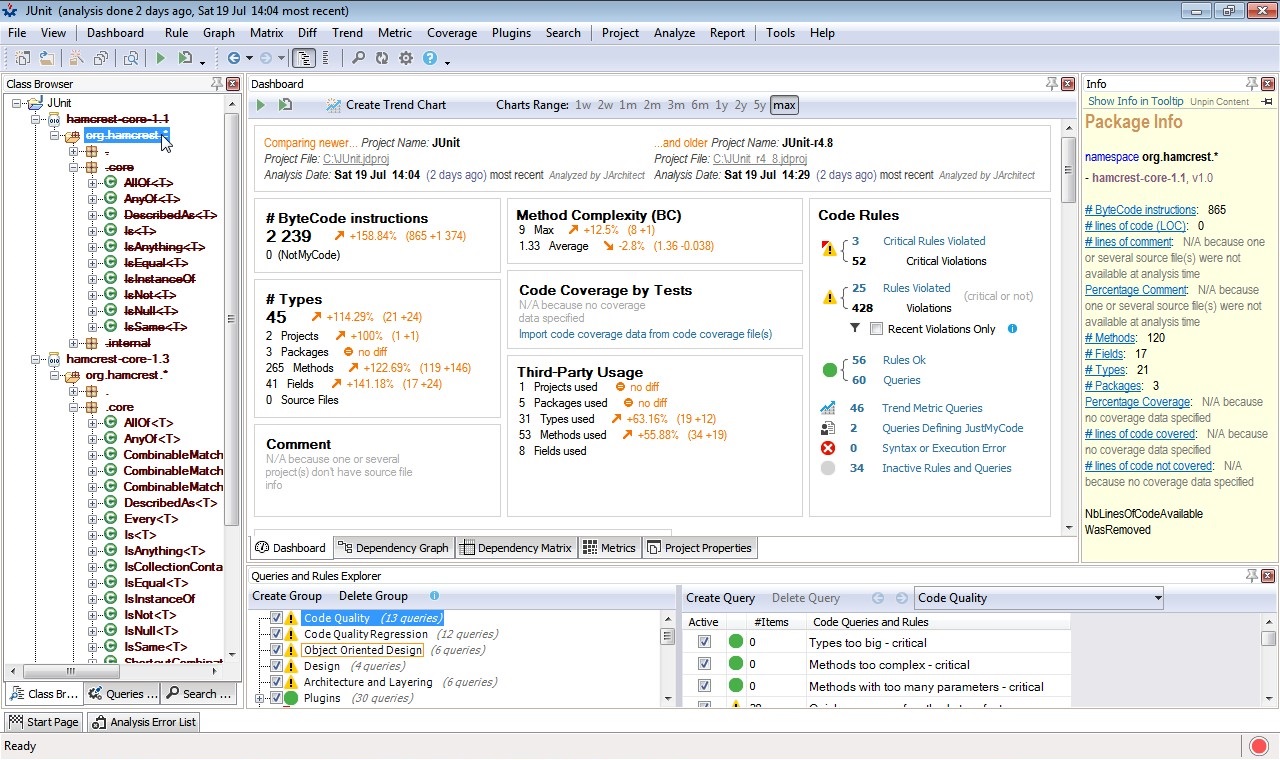
Editing a Trend Chart.
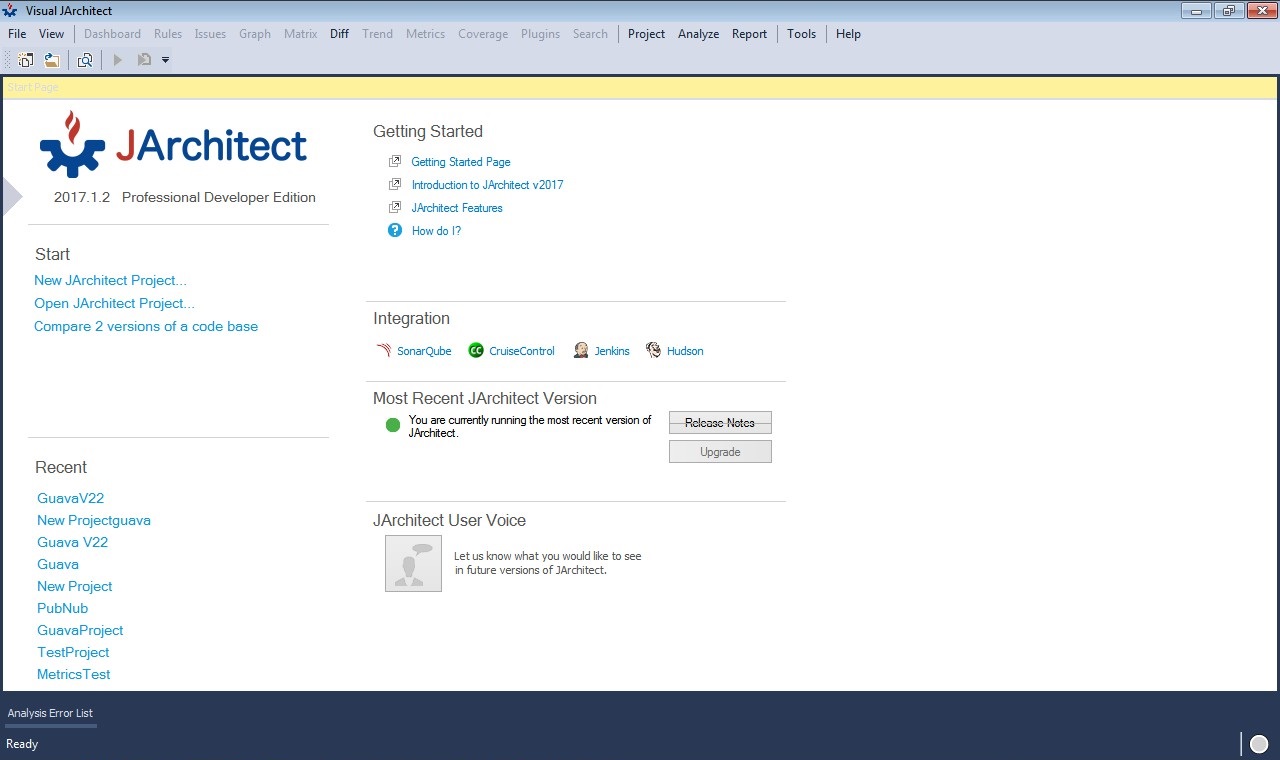
The Start page.
JArchitect for Mac OSX
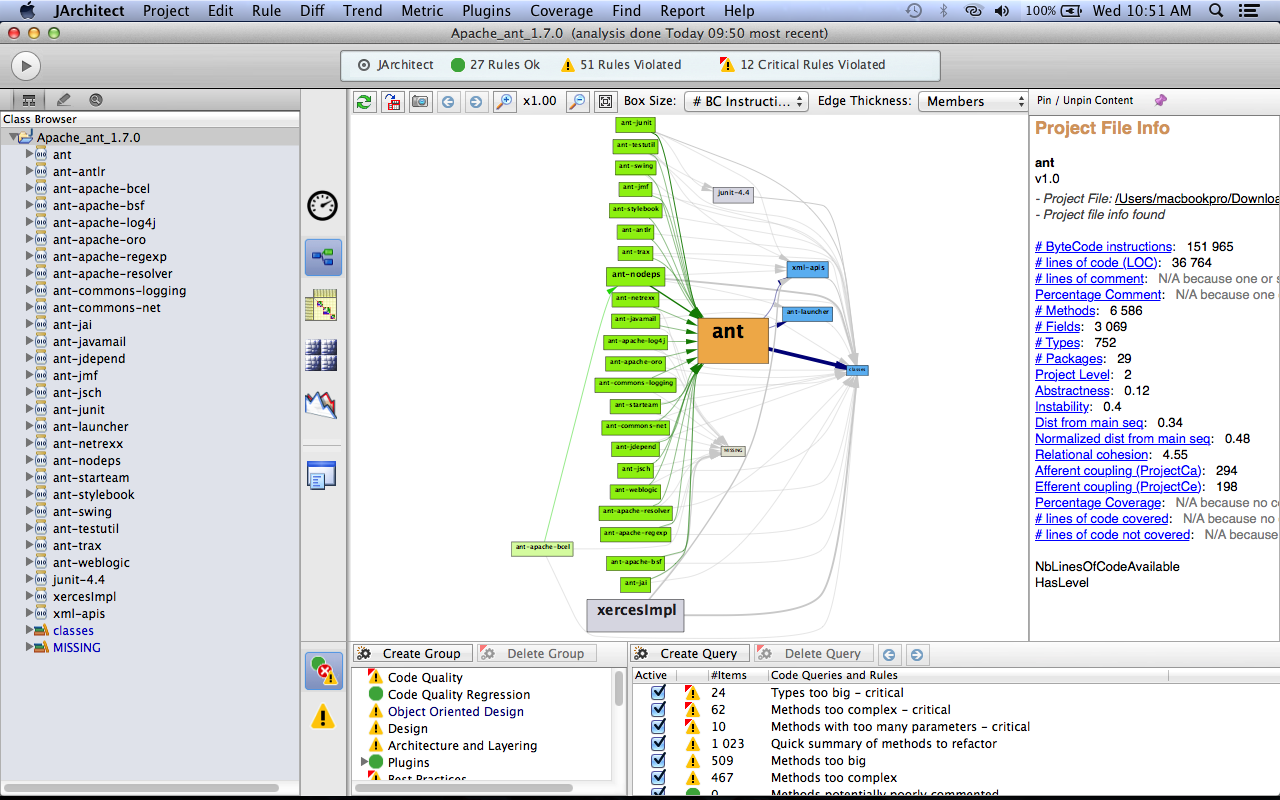
Using the Graph view to browse the structure.
A generated graph of dependencies between some projects.
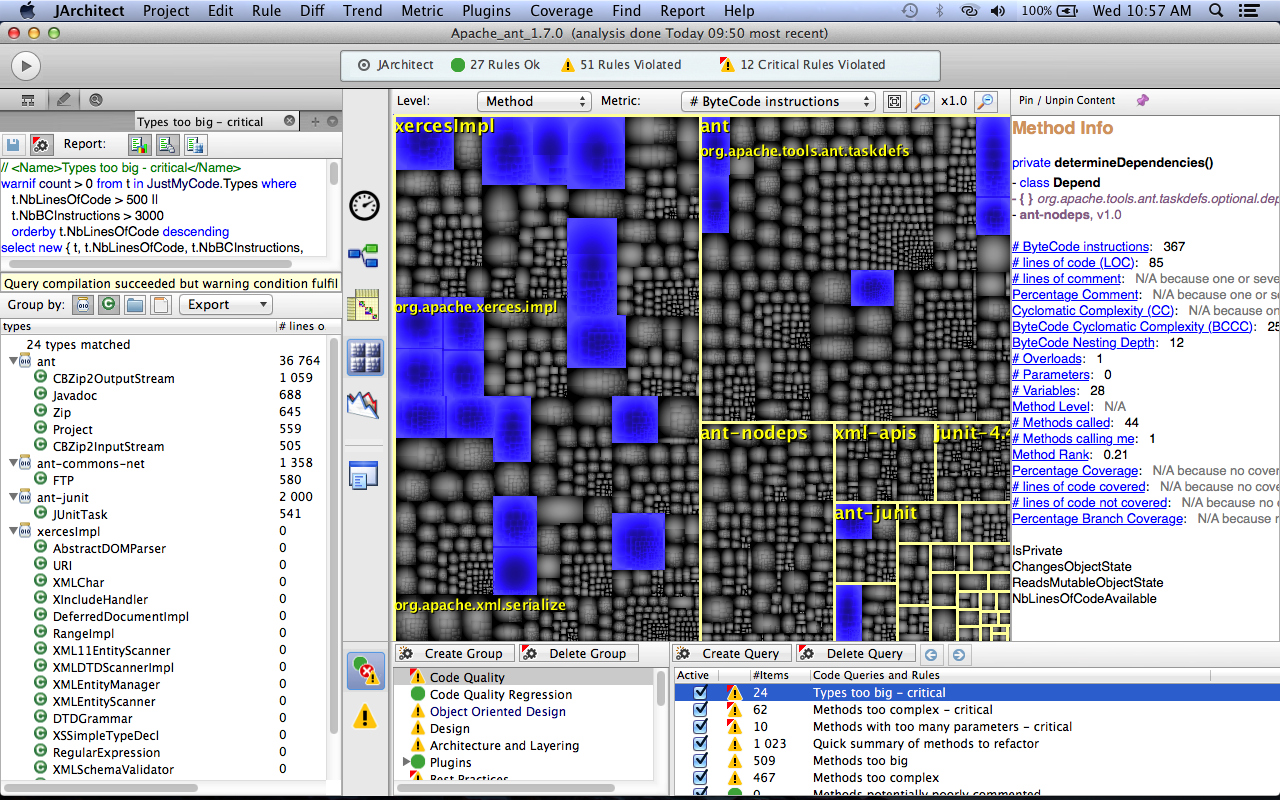
Selection by Metrics and display of the types set selected on the Metrics View.
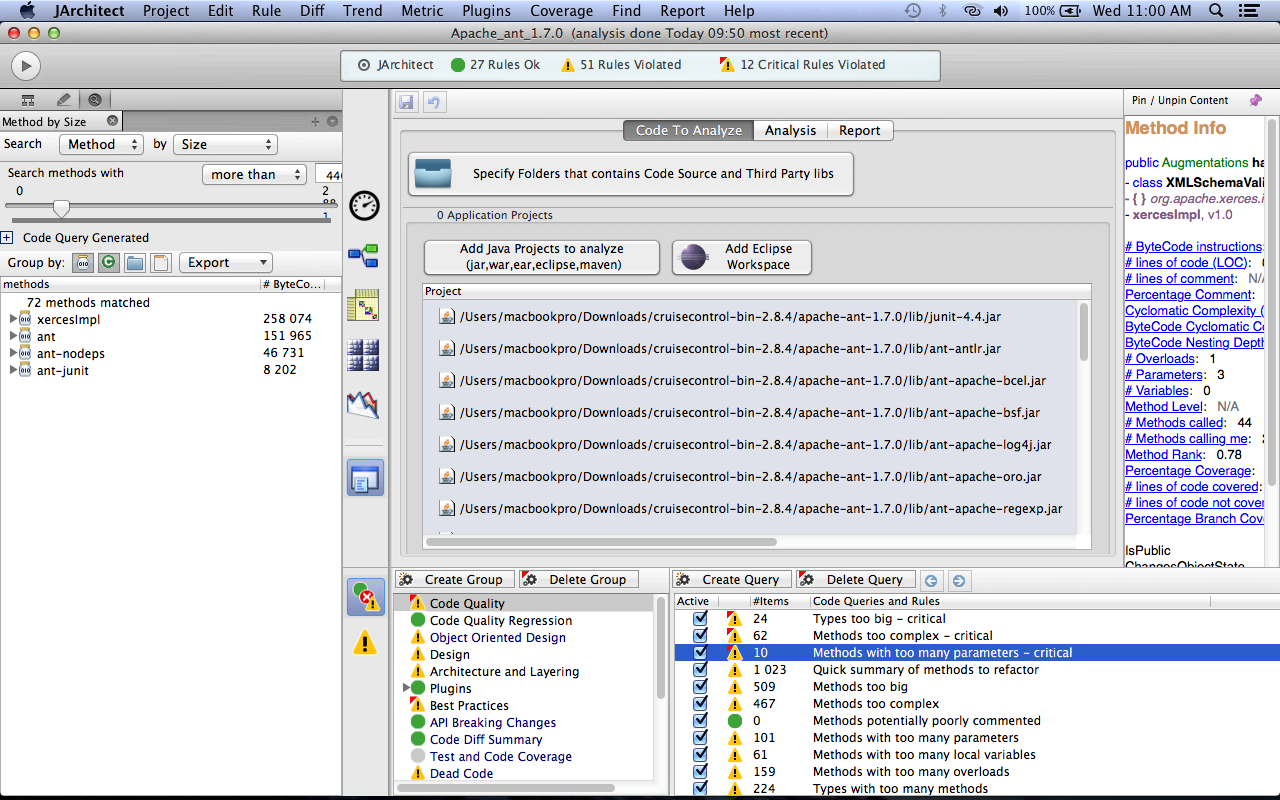
Selecting projects to analyze (on code to analyse sub panel). The selected projects will be added automatically to the list.
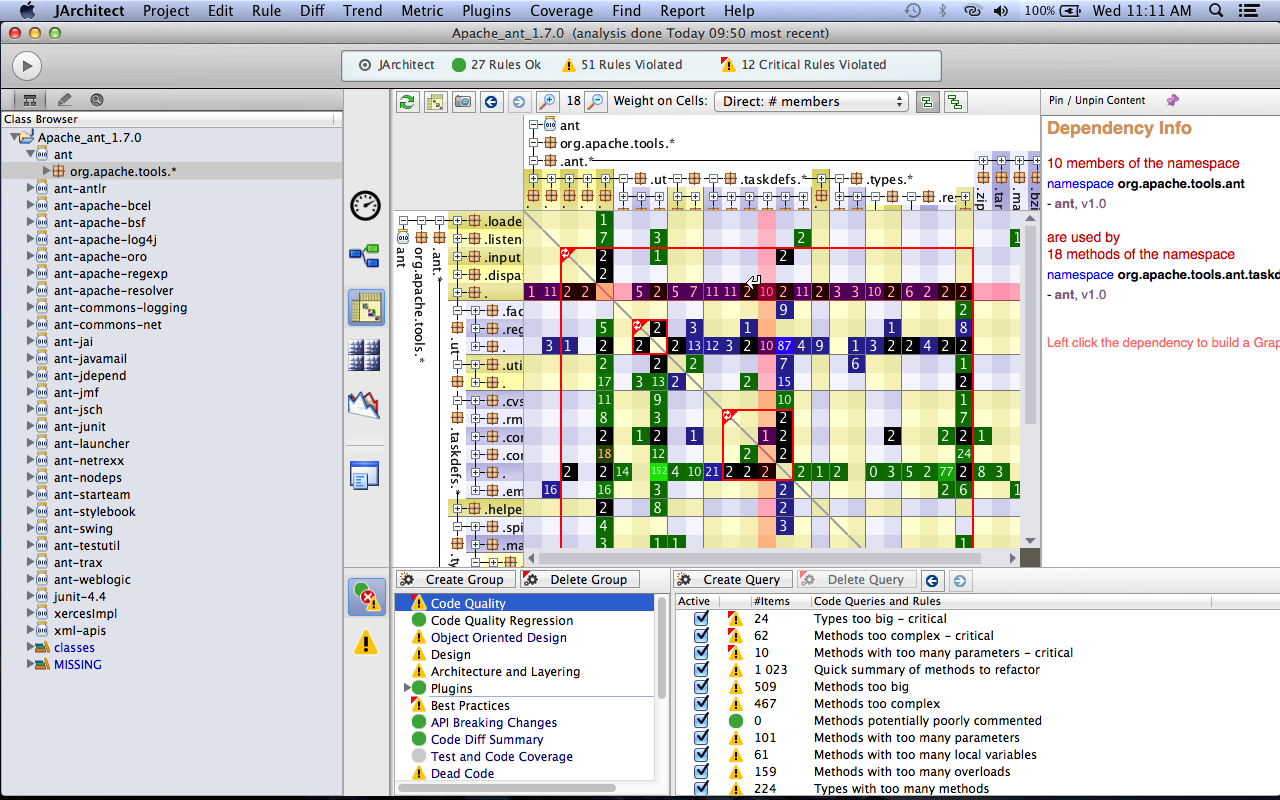
Using the Dependencies Structure Matrix to understand coupling between projects.
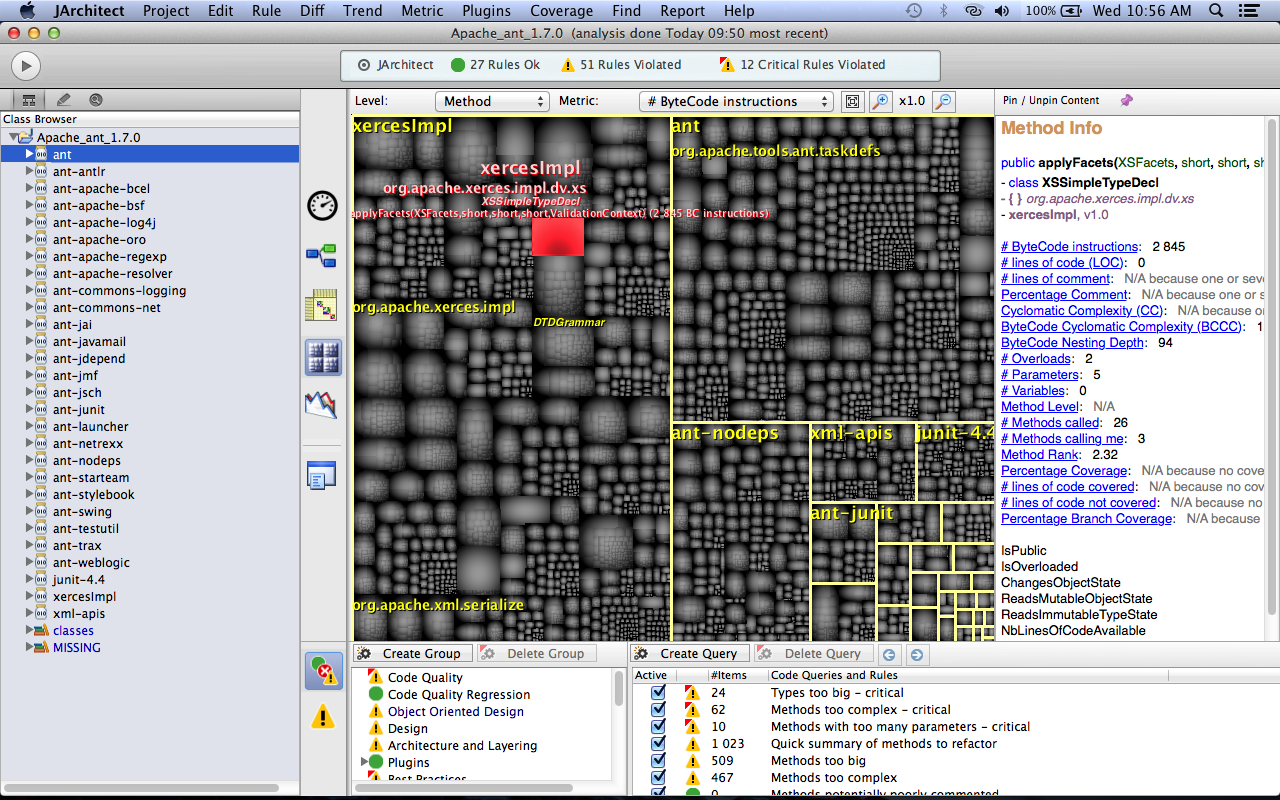
Using the Metrics view to browse the structure.
Rich Code Search Facilities.
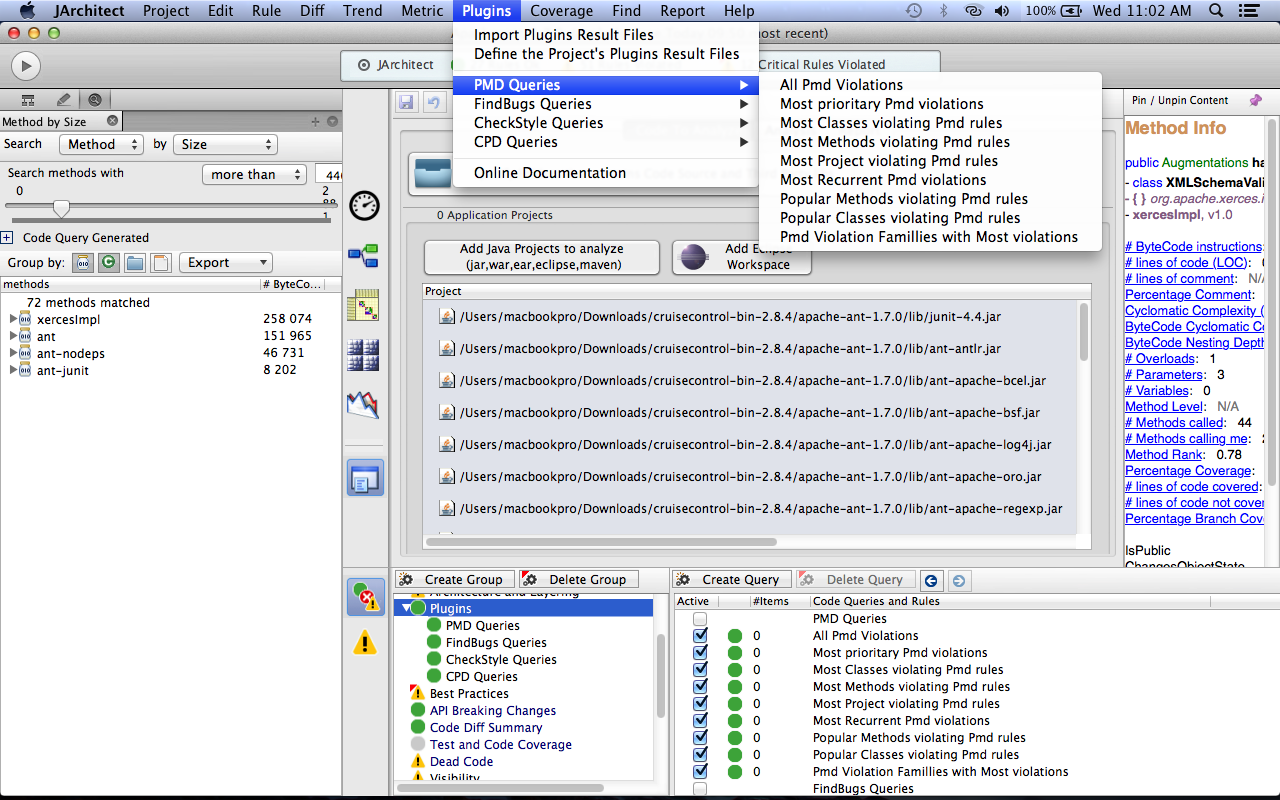
Using the Plugins menu to import and display results from other useful Java tools.
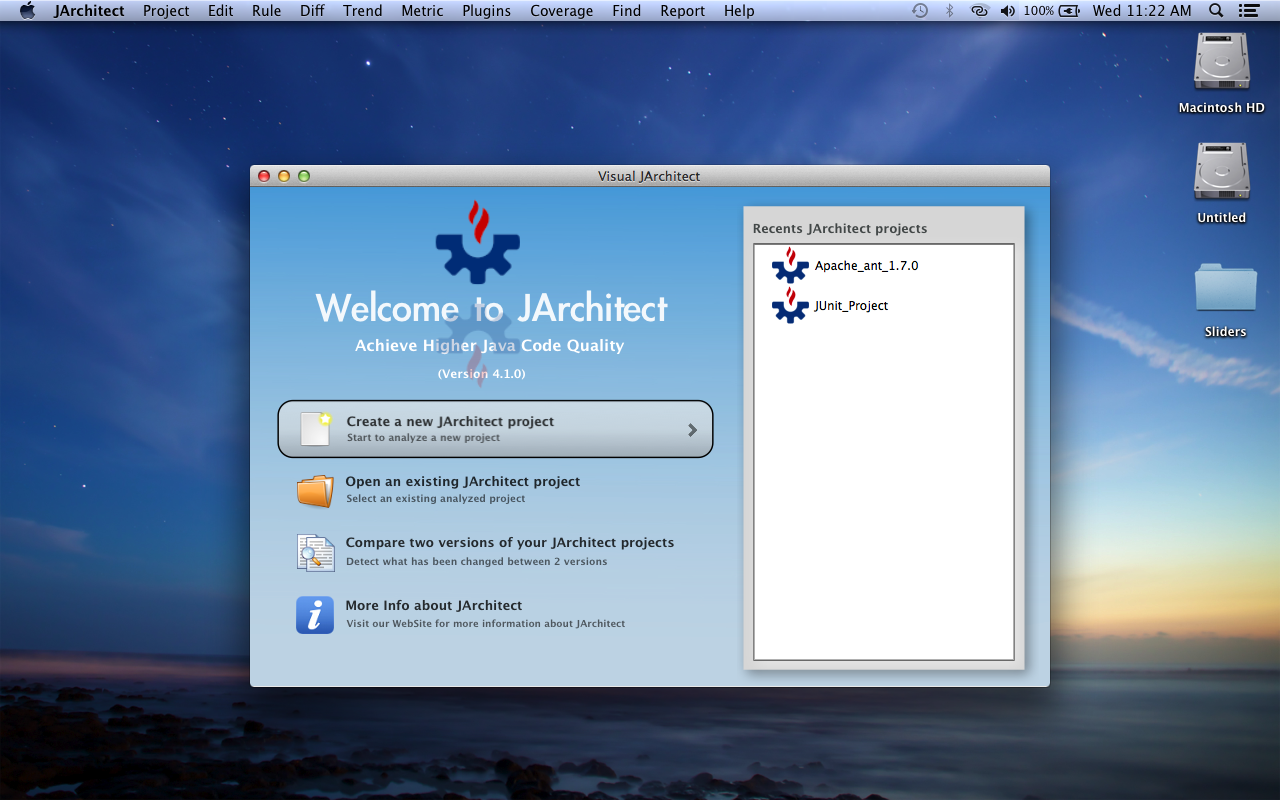
The Start page.
Project Management
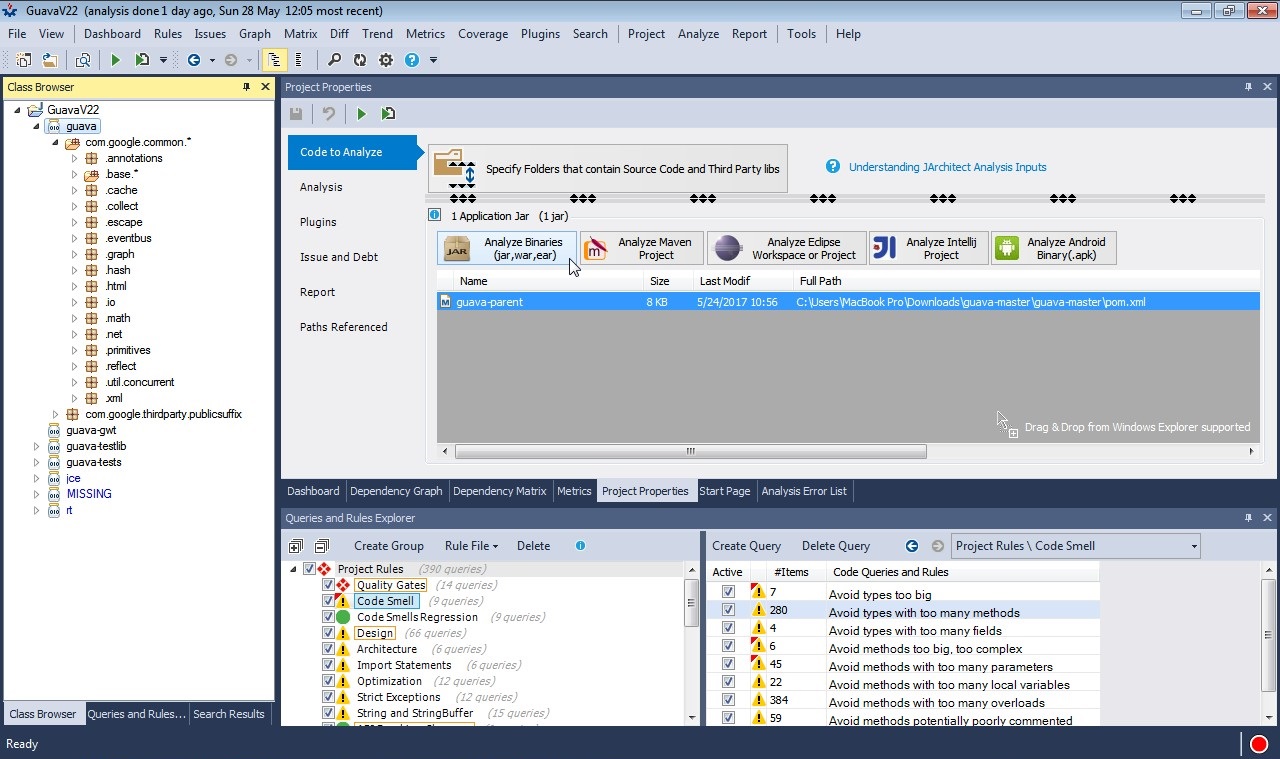
Selecting projects to analyze (on code to analyse sub panel). The selected projects will be added automatically to the list.
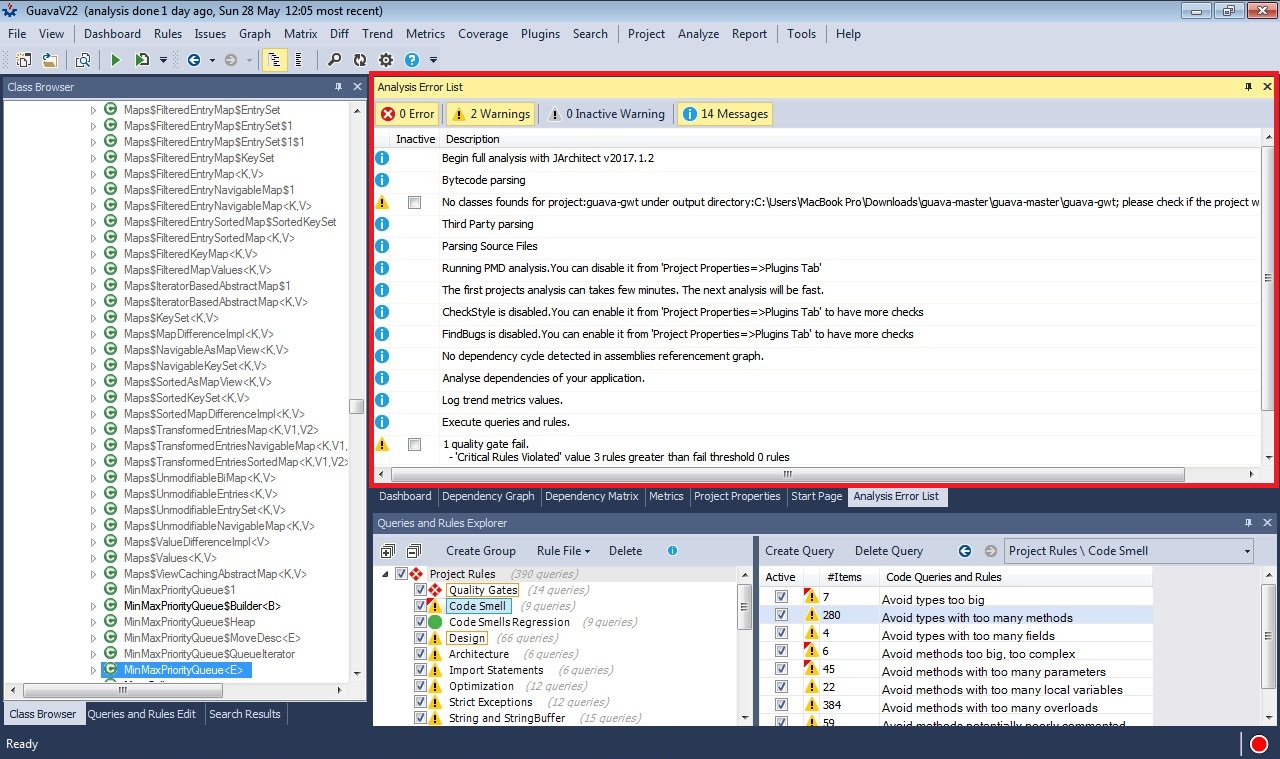
Information and warnings about the health of the Build process, emitted during analysis.
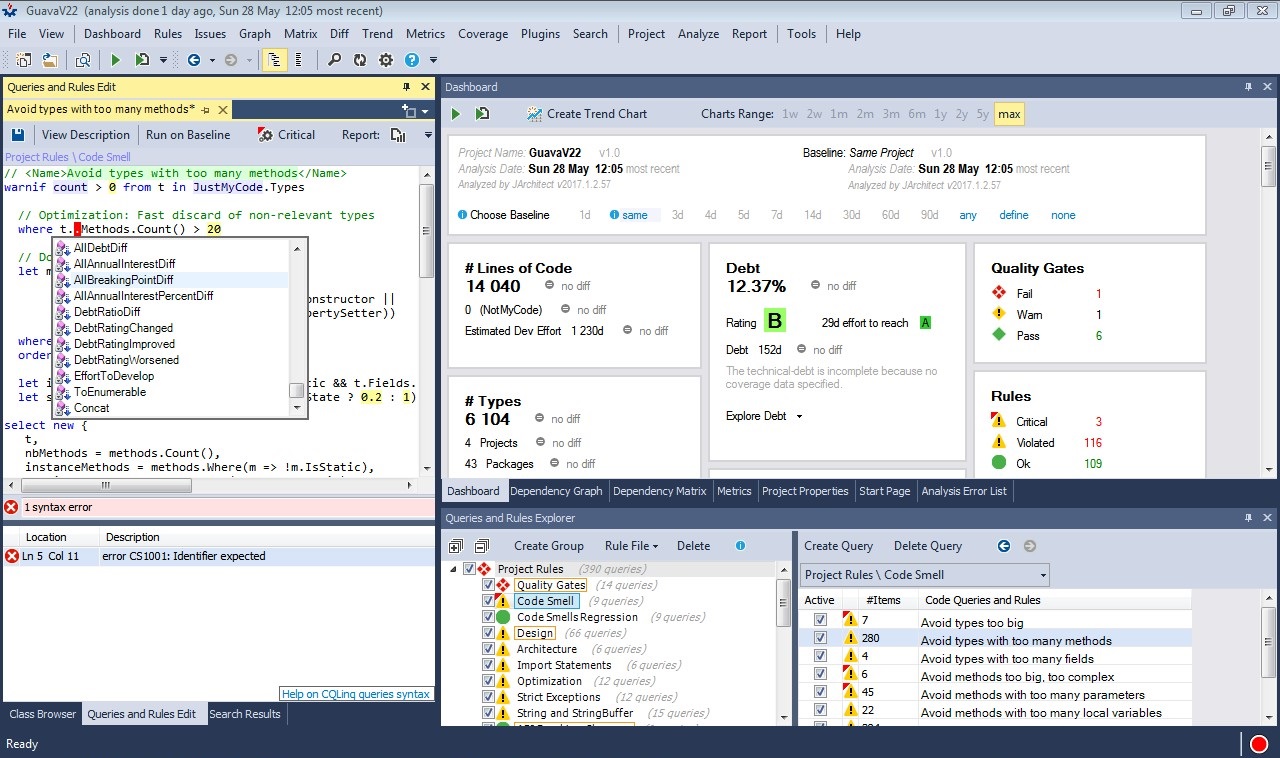
Details of the CQLinq queries edition with intellisense
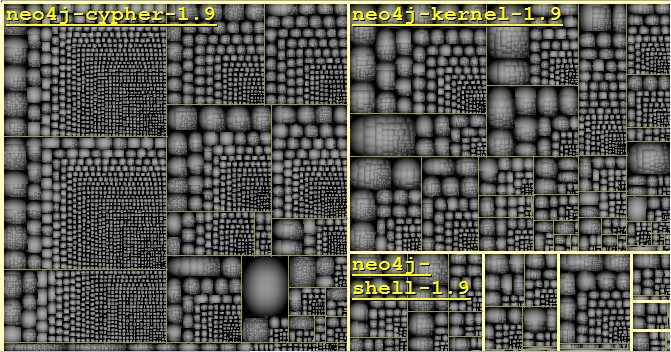
Posters built by JArchitect
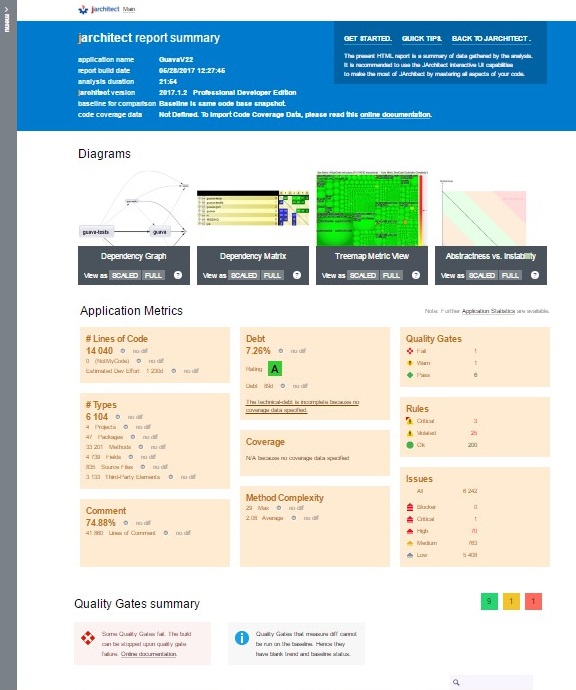
With JArchitect, software quality can be measured using Code Metrics, visualized using Graphs and Treemaps, and enforced using standard and custom Rules.